1.7 KiB
Profiling Meilisearch
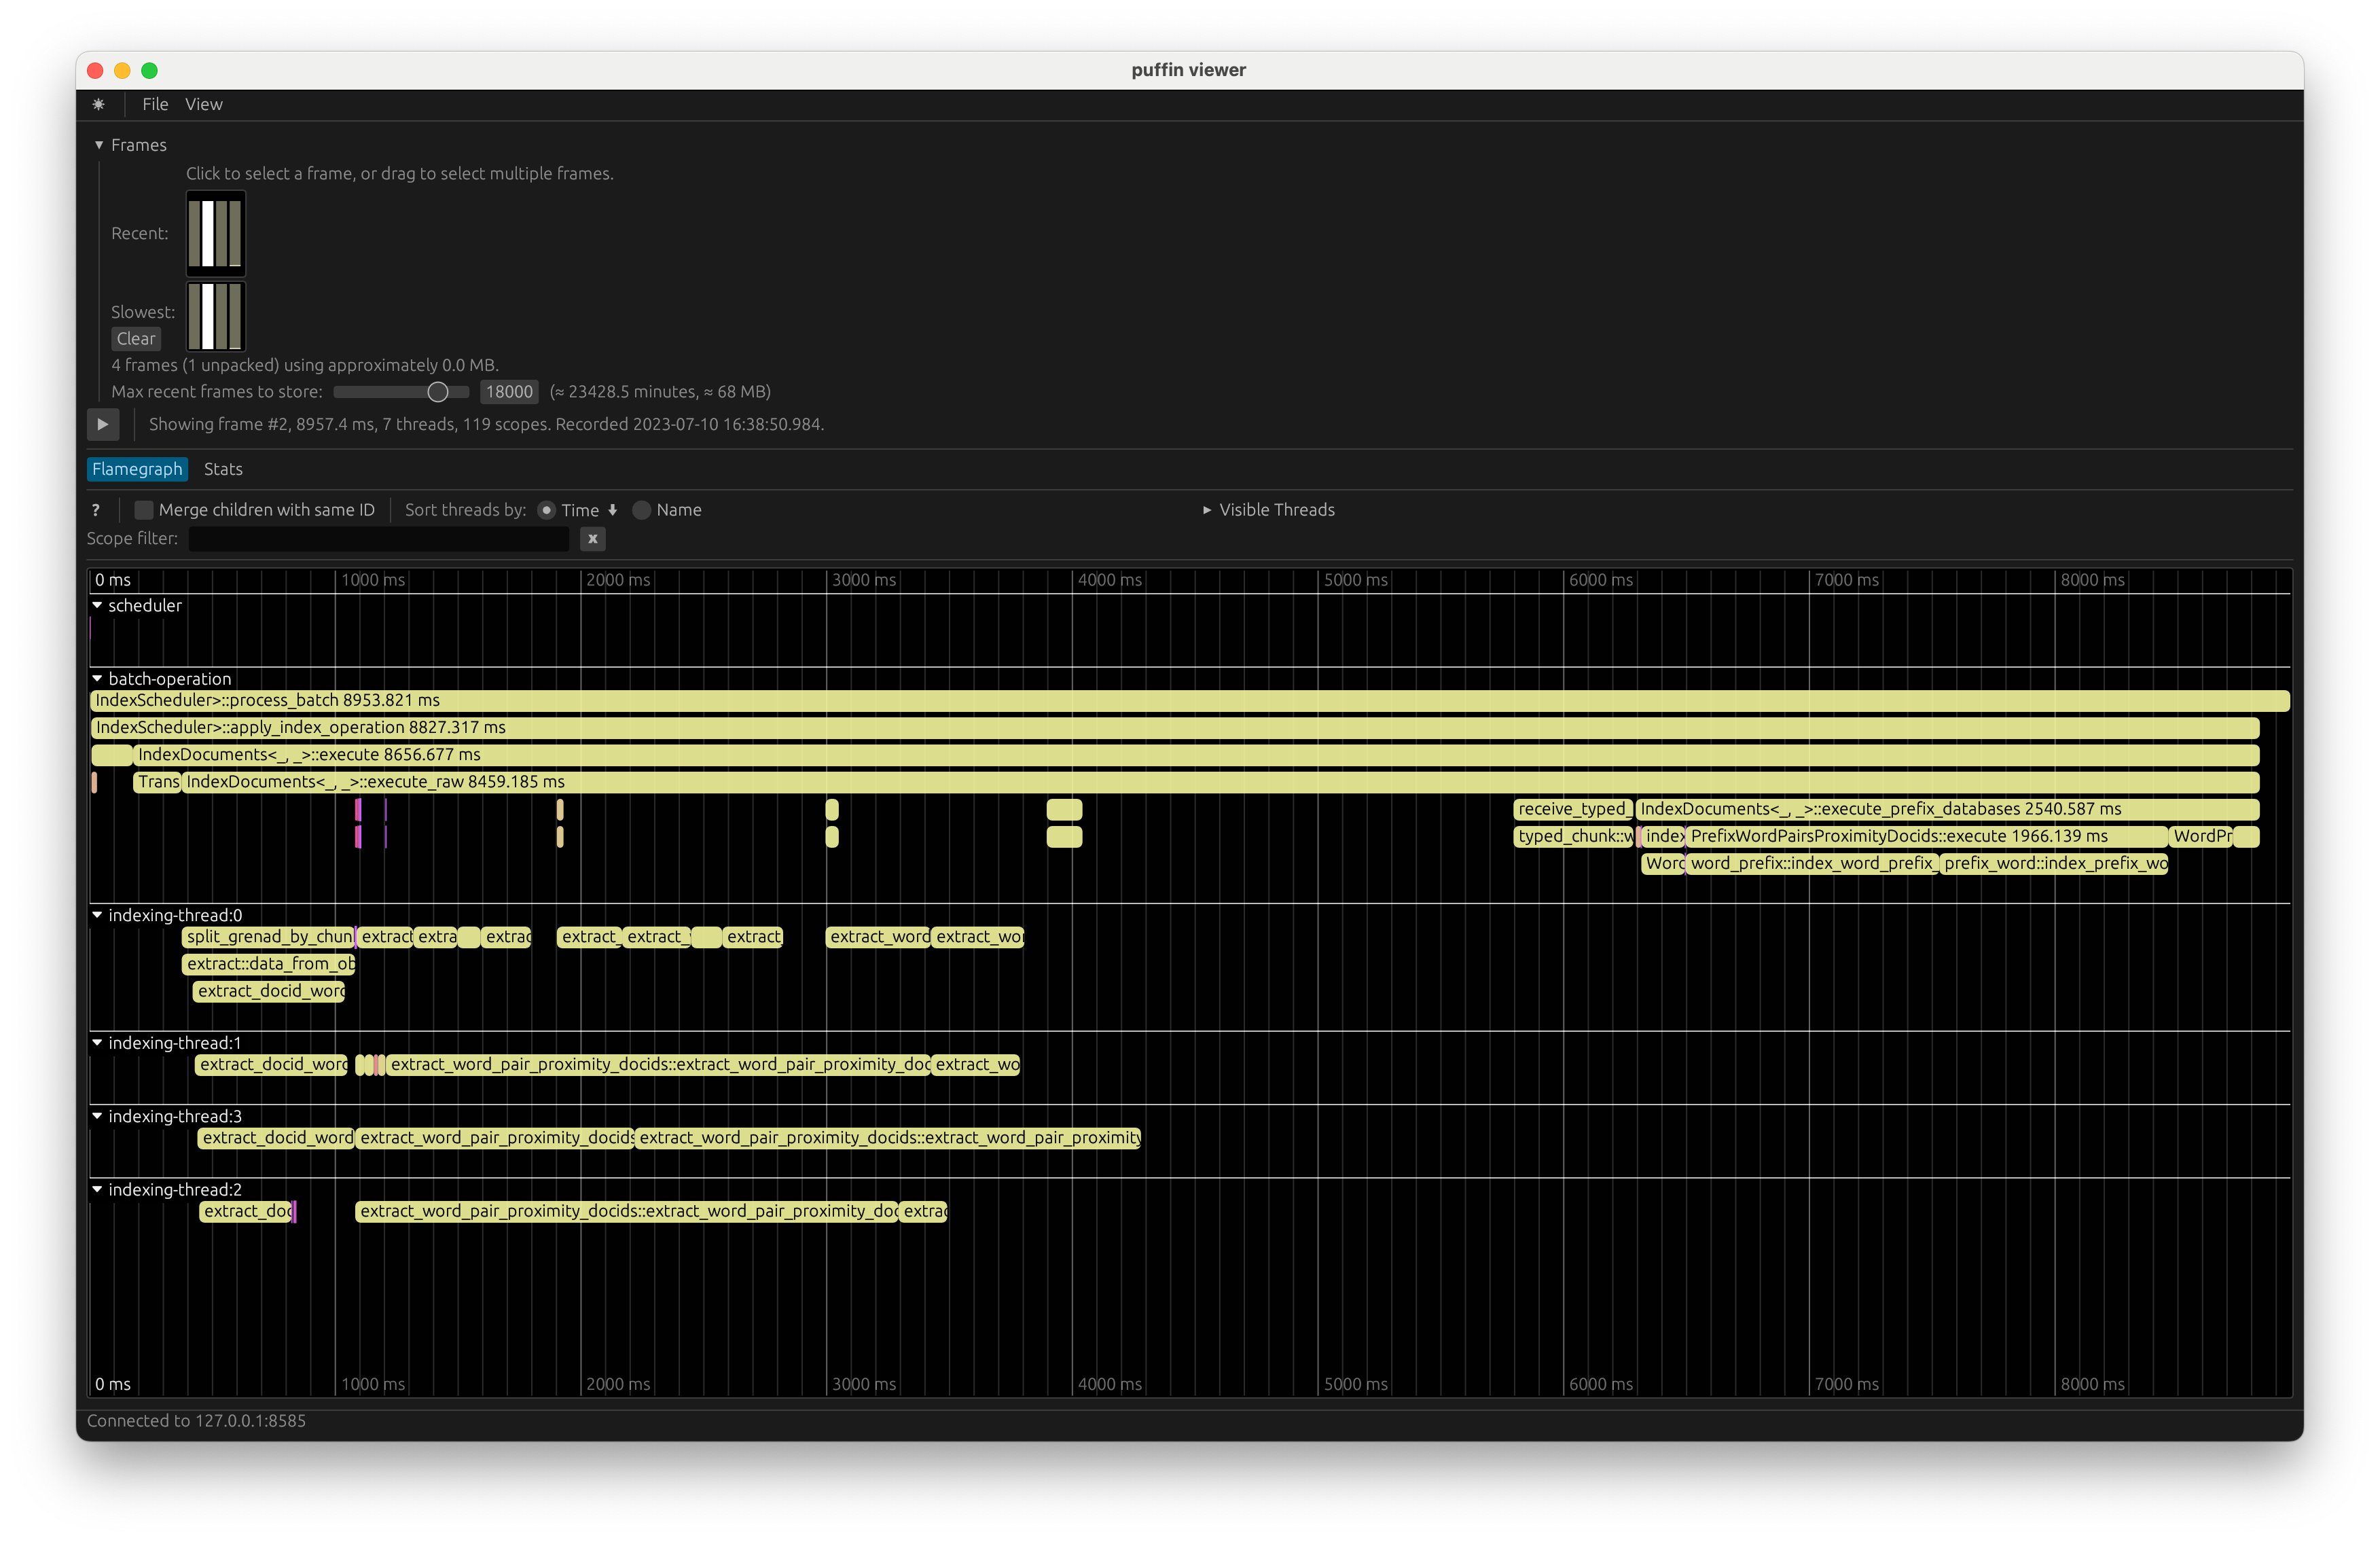
Search engine technologies are complex pieces of software that require thorough profiling tools. We chose to use Puffin, which the Rust gaming industry uses extensively. You can export and import the profiling reports using the top bar's File menu options.
Profiling the Indexing Process
When you enable the profile-with-puffin feature of Meilisearch, a Puffin HTTP server will run on Meilisearch and listen on the default 0.0.0.0:8585 address. This server will record a "frame" whenever it executes the IndexScheduler::tick method.
Once your Meilisearch is running and awaits new indexation operations, you must install and run the puffin_viewer tool to see the profiling results. I advise you to run the viewer with the RUST_LOG=puffin_http::client=debug environment variable to see the client trying to connect to your server.
Another piece of advice on the Puffin viewer UI interface is to consider the Merge children with same ID option. It can hide the exact actual timings at which events were sent. Please turn it off when you see strange gaps on the Flamegraph. It can help.
Profiling the Search Process
We still need to take the time to profile the search side of the engine with Puffin. It would require time to profile the filtering phase, query parsing, creation, and execution. We could even profile the Actix HTTP server.
The only issue we see is the framing system. Puffin requires a global frame-based profiling phase, which collides with Meilisearch's ability to accept and answer multiple requests on different threads simultaneously.
